Moderated Regression#
Exercise 1: The Dataset#
Since this chapter didn’t introduce many new concepts, we will also take some time to review and practice skills you’ve learned in previous chapters.
Today’s dataset includes various variables related to student stress factors and mental health. It is included in the teaching materials, so you can either load it directly from your files, or by providing the URL:
pd.read_csv("data/StressLevelDataset.csv", delimiter=',')pd.read_csv("https://raw.githubusercontent.com/mibur1/psy111/main/book/statistics/4_Moderated_Reg/data/StressLevelDataset.csv", delimiter=',')
Your research question will be: Does social support moderate the effect of anxiety on self-esteem?
Load and explore the dataset.
Select only the variables relevant to your research question (subset the dataset), and save it to a new DataFrame. Make sure to create a deep copy by using
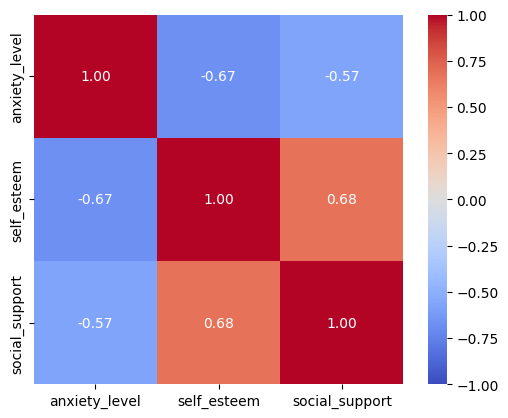
.copy()Create a correlation matrix for the three variables of interest (anxiety, social support, and self-esteem).
import pandas as pd
import seaborn as sns
import matplotlib.pyplot as plt

df = pd.read_csv("https://raw.githubusercontent.com/mibur1/psy111/main/book/statistics/4_Moderated_Reg/data/StressLevelDataset.csv", delimiter=',')
print(df.head())
df_small=df[['anxiety_level', 'self_esteem', 'social_support']].copy()

print(df_small.head())
print(df_small.describe())
corr_matrix = df_small.corr()

sns.heatmap(corr_matrix, annot=True, cmap='coolwarm', square=True, center=0, vmin=-1, vmax=1, fmt=".2f");
   anxiety_level  self_esteem  mental_health_history  depression  headache  \
0             14           20                      0          11         2
1             15            8                      1          15         5
2             12           18                      1          14         2
3             16           12                      1          15         4
4             16           28                      0           7         2

   blood_pressure  sleep_quality  breathing_problem  noise_level  \
0               1              2                  4            2
1               3              1                  4            3
2               1              2                  2            2
3               3              1                  3            4
4               3              5                  1            3

   living_conditions  ...  basic_needs  academic_performance  study_load  \
0                  3  ...            2                     3           2
1                  1  ...            2                     1           4
2                  2  ...            2                     2           3
3                  2  ...            2                     2           4
4                  2  ...            3                     4           3

   teacher_student_relationship  future_career_concerns  social_support  \
0                             3                       3               2
1                             1                       5               1
2                             3                       2               2
3                             1                       4               1
4                             1                       2               1

   peer_pressure  extracurricular_activities  bullying  stress_level
0              3                           3         2             1
1              4                           5         5             2
2              3                           2         2             1
3              4                           4         5             2
4              5                           0         5             1

[5 rows x 21 columns]
   anxiety_level  self_esteem  social_support
0             14           20               2
1             15            8               1
2             12           18               2
3             16           12               1
4             16           28               1
       anxiety_level  self_esteem  social_support
count    1100.000000  1100.000000     1100.000000
mean       11.063636    17.777273        1.881818
std         6.117558     8.944599        1.047826
min         0.000000     0.000000        0.000000
25%         6.000000    11.000000        1.000000
50%        11.000000    19.000000        2.000000
75%        16.000000    26.000000        3.000000
max        21.000000    30.000000        3.000000
Exercise 2#
Center the variables anxiety_level and self_esteem by subtracting their mean values. Save the centered variables to new columns in your DataFrame.
Perform a moderated regression modelling the main effects of, as well as interaction effects between,
anxiety_centeredandsocial_supportonself_esteem_centered.Take some time to interpret the outputs (similar to as shown in the previous section).
Warning: social_support is NOT a continuous variable. You can, for example, use dummy coding for your model.
import statsmodels.formula.api as smf

df_small['anxiety_centered'] = df_small['anxiety_level'] - df_small['anxiety_level'].mean()
df_small['self_esteem_centered'] = df_small['self_esteem'] - df_small['self_esteem'].mean()

model = smf.ols('self_esteem_centered ~ anxiety_centered * C(social_support, Treatment(reference=0))', data=df_small)
results = model.fit()
print(results.summary())
                             OLS Regression Results
================================================================================
Dep. Variable:     self_esteem_centered   R-squared:                       0.658
Model:                              OLS   Adj. R-squared:                  0.655
Method:                   Least Squares   F-statistic:                     299.6
Date:                  Tue, 04 Feb 2025   Prob (F-statistic):          5.40e-249
Time:                          20:24:33   Log-Likelihood:                -3381.0
No. Observations:                  1100   AIC:                             6778.
Df Residuals:                      1092   BIC:                             6818.
Df Model:                             7
Covariance Type:              nonrobust
===================================================================================================================================
                                                                      coef    std err          t      P>|t|      [0.025      0.975]
-----------------------------------------------------------------------------------------------------------------------------------
Intercept                                                          -2.3500      0.566     -4.155      0.000      -3.460      -1.240
C(social_support, Treatment(reference=0))[T.1]                     -3.7287      0.659     -5.661      0.000      -5.021      -2.436
C(social_support, Treatment(reference=0))[T.2]                      4.6271      0.718      6.445      0.000       3.218       6.036
C(social_support, Treatment(reference=0))[T.3]                      6.4209      0.666      9.638      0.000       5.114       7.728
anxiety_centered                                                    0.0706      0.093      0.756      0.450      -0.113       0.254
anxiety_centered:C(social_support, Treatment(reference=0))[T.1]    -0.5228      0.105     -4.986      0.000      -0.728      -0.317
anxiety_centered:C(social_support, Treatment(reference=0))[T.2]    -0.2959      0.263     -1.124      0.261      -0.812       0.220
anxiety_centered:C(social_support, Treatment(reference=0))[T.3]    -0.7646      0.110     -6.936      0.000      -0.981      -0.548
==============================================================================
Omnibus:                       51.631   Durbin-Watson:                   2.107
Prob(Omnibus):                  0.000   Jarque-Bera (JB):              103.950
Skew:                           0.307   Prob(JB):                     2.68e-23
Kurtosis:                       4.375   Cond. No.                         54.7
==============================================================================

Notes:
[1] Standard Errors assume that the covariance matrix of the errors is correctly specified.
Exercise 3: Quiz#
Please answer the following questions:
from jupyterquiz import display_quiz

display_quiz('https://raw.githubusercontent.com/mibur1/psy111/main/book/solutions/quiz/question1.json')
display_quiz('https://raw.githubusercontent.com/mibur1/psy111/main/book/solutions/quiz/question2.json')
Voluntary exercise#
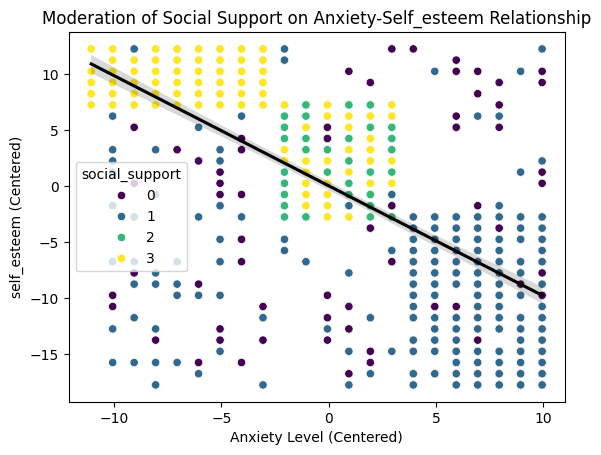
Create a scatterplot to visualize the relationship between anxiety and self_esteem. Adding a linear regression line. Use social_support as the hue to differentiate groups.
import seaborn as sns
import matplotlib.pyplot as plt

fig, ax = plt.subplots()
sns.scatterplot(data=df_small, x='anxiety_centered', y='self_esteem_centered', hue='social_support', palette='viridis', legend='full', ax=ax)
sns.regplot(data=df_small, x='anxiety_centered', y='self_esteem_centered', scatter=False, color='black', ax=ax)

ax.set_xlabel('Anxiety Level (Centered)')
ax.set_ylabel('self_esteem (Centered)')
ax.set_title('Moderation of Social Support on Anxiety-Self_esteem Relationship')

plt.show()